Calculate Percent Change in Excel: Pro Guide
Whether you’re tracking material costs for a home renovation project, monitoring budget overruns on a basement finishing job, or analyzing price fluctuations for supplies, knowing how to calculate percent change in Excel is an essential skill for any DIY builder. Percent change calculations help you understand the magnitude of increases or decreases in values—critical information when planning projects and managing finances.
Excel makes this calculation straightforward through simple formulas that can be applied to any dataset. From comparing lumber prices across seasons to tracking labor cost inflation, mastering percent change calculations empowers you to make data-driven decisions for your DIY projects. This guide walks you through multiple methods, from basic formulas to advanced techniques that save time on complex spreadsheets.
Understanding Percent Change Formula
The foundation of any percent change calculation is the mathematical formula: ((New Value – Old Value) / Old Value) × 100. This formula measures how much a value has changed relative to its starting point, expressed as a percentage. Understanding this concept is crucial before diving into Excel implementation.
The numerator (New Value – Old Value) represents the absolute change—the actual difference between two numbers. Dividing by the old value normalizes this change, accounting for the scale of the original number. Multiplying by 100 converts the decimal result to a percentage format that’s easy to interpret. For example, if drywall cost $15 per sheet last year and $18 this year, the calculation would be ((18-15)/15)×100 = 20%, representing a 20% price increase.
This formula works for any scenario: positive changes (increases), negative changes (decreases), and even when comparing values that cross zero. When the old value is zero, the formula produces an error or undefined result, which requires special handling in Excel. Understanding when and why to use this formula ensures accurate budget planning for your DIY basement finishing projects and other construction endeavors.

Basic Percent Change Calculation in Excel
The most straightforward method involves entering the formula directly into an Excel cell. Start by organizing your data with the old value in one column and the new value in an adjacent column. For example, place the original price in cell B2 and the updated price in cell C2.
In a nearby cell (such as D2), type the formula: =((C2-B2)/B2)*100. Press Enter, and Excel instantly calculates the percent change. If the result is positive, the value increased; if negative, it decreased. This basic approach works perfectly for single calculations or small datasets.
To display the result as a proper percentage, you can format the cell as a percentage type. However, if you use the formula above, you’ve already multiplied by 100, so the percentage format would show 2000% instead of 20%. Instead, modify the formula to =((C2-B2)/B2) without the ×100, then apply percentage formatting. This cleaner approach is preferred for professional spreadsheets and makes the data more readable.
For those working with complex projects involving cost calculations, Excel’s flexibility allows you to adjust the formula based on your specific needs. Some builders prefer displaying results as decimals, while others want whole percentages—Excel accommodates both preferences effortlessly.
Using the Formula for Multiple Values
When comparing multiple items—such as price changes across different building materials or cost increases for various project phases—you’ll want to apply the formula to entire columns efficiently. Excel’s copy-and-paste functionality makes this process seamless.
First, enter your data with old values in column B and new values in column C, with each row representing a different item. In cell D2, enter the percent change formula: =((C2-B2)/B2). Select cell D2, then copy it (Ctrl+C). Highlight the range D3 through D10 (or however many rows you have), and paste (Ctrl+V). Excel automatically adjusts the cell references for each row, calculating percent change for all items simultaneously.
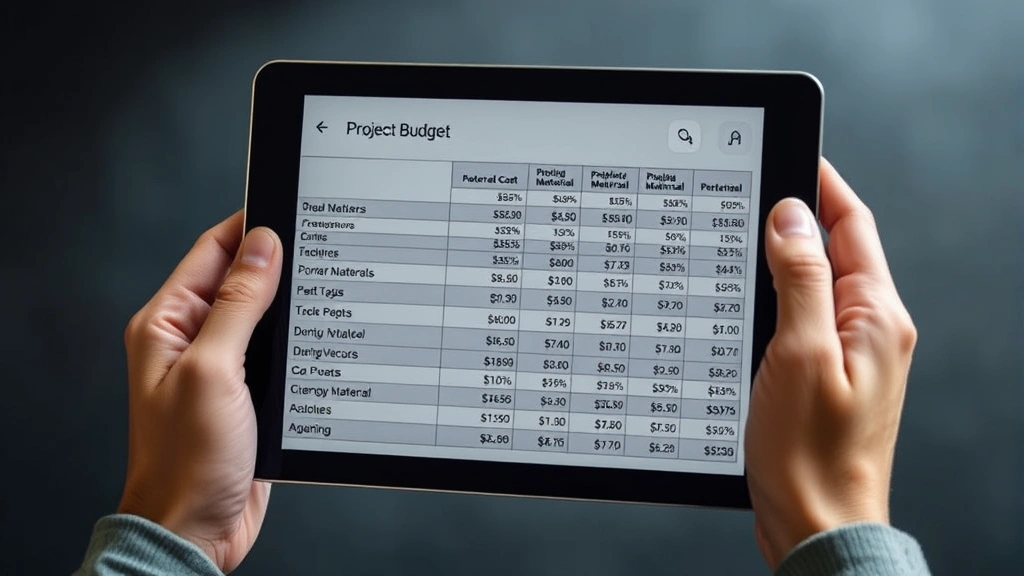
This method is invaluable for budget tracking. Imagine you’re renovating your home and tracking price changes for: lumber, concrete, fasteners, electrical components, and plumbing supplies. By setting up this formula structure once, you can quickly see which materials have increased most dramatically, helping you prioritize cost-saving measures or adjust your project budget accordingly.
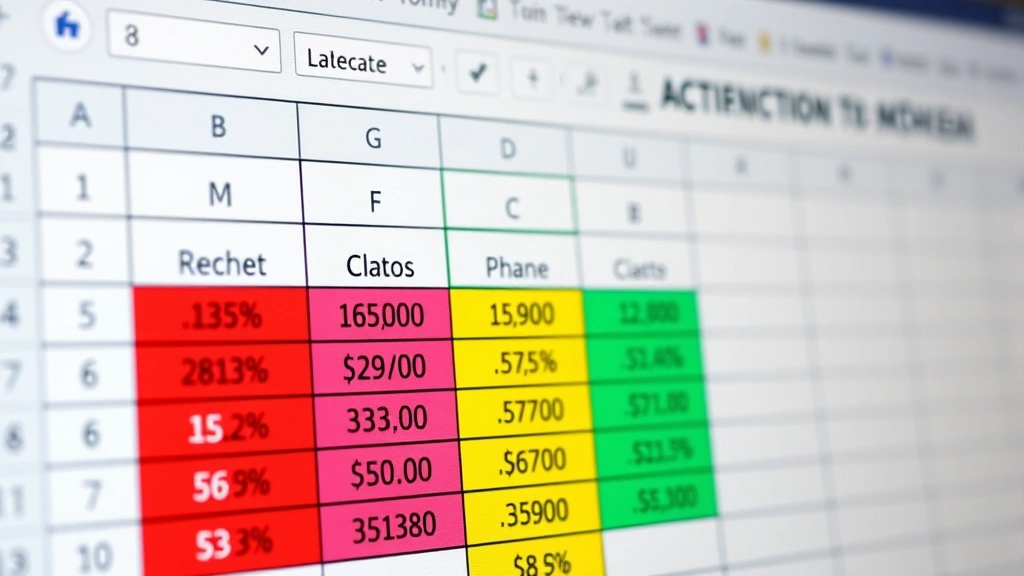
You can enhance this approach by adding conditional formatting to highlight significant changes. Right-click the results column and select “Conditional Formatting.” Create rules that color-code cells: red for increases above 10%, green for decreases, and yellow for moderate changes. This visual representation makes it immediately obvious which costs require attention, essential for managing large renovation projects effectively.
Advanced Techniques and Formatting
Beyond basic calculations, Excel offers advanced features that streamline percent change analysis. The TEXT function allows you to format results with specific decimal places and symbols. For example: =TEXT(((C2-B2)/B2),”0.00%”) displays the result with exactly two decimal places and a percent symbol automatically applied.
Another powerful technique involves using absolute references when comparing multiple values to a single baseline. If you’re tracking how different project costs compare to an original budget, use a formula like =((C2-$B$2)/$B$2). The dollar signs lock the reference to cell B2, so when you copy the formula down, it always compares against the same baseline value while the comparison values (C2, C3, C4, etc.) change automatically.
For comprehensive project management, create a summary section that calculates the average percent change across all items. Use the AVERAGE function: =AVERAGE(D2:D10). This gives you a single metric representing overall cost inflation or deflation across your project materials. Combined with MAX and MIN functions, you can identify the highest and lowest percent changes with formulas like =MAX(D2:D10) and =MIN(D2:D10).
When working with negative starting values or comparing values across zero, be cautious. The standard percent change formula can produce misleading results. In these cases, consider using percentage point change (New Value – Old Value) instead, or document your methodology clearly so stakeholders understand your calculations. Many professional builders consult project management standards when handling complex financial calculations.
Real-World DIY Applications
Understanding percent change proves invaluable across numerous DIY scenarios. When planning a basement renovation, you might track how lumber prices have changed month-to-month, helping you decide whether to purchase materials immediately or wait for potential price drops. A 15% increase might justify front-loading your purchases, while a slight 2% change might not warrant immediate action.
Home security upgrades present another practical application. If you’re implementing DIY home security systems, you might compare equipment costs from different suppliers or track how prices change across seasons. Security cameras might be 30% cheaper during holiday sales compared to regular pricing, making seasonal purchasing strategy crucial for budget-conscious builders.
For ongoing vehicle maintenance and repairs, tracking percent changes in parts costs helps you budget for future work. If spark plugs increased 25% in the past year, you can project similar increases for other components and plan accordingly. This forward-thinking approach prevents budget surprises and helps prioritize repair schedules.
Project cost tracking across multiple phases benefits enormously from percent change analysis. If phase one of your renovation came in 12% over budget, you can adjust expectations and resource allocation for subsequent phases. This data-driven approach transforms raw numbers into actionable intelligence for better project management.
Common Mistakes to Avoid
One frequent error involves confusing percent change with percentage points. If a value increases from 20% to 25%, that’s a 5 percentage point change, but a 25% percent change ((25-20)/20=0.25). These are different concepts with different implications for your projects.
Another common mistake occurs when the old value is zero or negative. The formula breaks down mathematically, producing errors or meaningless results. Always validate your data before applying formulas across large datasets. Use the IFERROR function to handle these situations gracefully: =IFERROR(((C2-B2)/B2),”N/A”). This displays “N/A” instead of an error, making it obvious that the calculation couldn’t be completed.
Forgetting to apply consistent decimal place formatting creates confusion. Some results might show as 0.245 while others display as 24.5% or 2450%, depending on formatting choices. Establish a consistent format across your entire spreadsheet—preferably percentage format with two decimal places—to maintain clarity and professionalism.
Misinterpreting negative percent changes trips up many users. A -20% change means the value decreased by 20%, not that it became negative. When lumber prices drop from $20 to $16, the calculation yields ((16-20)/20) = -0.20 or -20%. This is good news for your budget, but the negative sign can cause confusion if not properly documented.
Additionally, avoid applying percent change calculations to values that shouldn’t be averaged or compared directly. For example, calculating percent change in temperature or pH levels requires different approaches than calculating price changes. Always consider whether percent change is the appropriate metric for your data before implementing formulas.
FAQ
What’s the difference between percent change and percentage increase?
Percent change and percentage increase are essentially the same concept—both measure how much a value has changed relative to its starting point, expressed as a percentage. The formula is identical: ((New Value – Old Value) / Old Value) × 100. The term “percentage increase” typically applies when values go up, while “percent change” encompasses both increases and decreases.
Can I calculate percent change for negative numbers?
Yes, but with caution. If both the old and new values are negative, the formula still works mathematically. However, if the old value is negative and the new value is positive (or vice versa), the result can be misleading. For example, changing from -$10 to +$10 appears as a 200% increase, which doesn’t accurately represent the practical change. In these cases, consider using absolute values or consulting financial analysis resources for alternative metrics.
How do I format the result to always show as a percentage?
After entering your formula without the ×100 (so it returns a decimal like 0.25), select the cell and click the percentage button in Excel’s toolbar, or right-click and choose “Format Cells.” Select “Percentage” from the category list. You can set the number of decimal places in this dialog. This automatically multiplies the decimal by 100 and adds the % symbol.
What if my spreadsheet has thousands of rows?
Excel handles large datasets efficiently. Enter your formula in the first data row, then select that cell and double-click the small square in the bottom-right corner (the fill handle). Excel automatically copies the formula down to all adjacent rows with data. Alternatively, select the cell, copy it, select your entire range, and paste. For extremely large datasets, Excel 365 offers dynamic array formulas that can process entire columns with a single formula.
Can I use percent change to compare budgets?
Absolutely. Percent change is ideal for budget comparisons. Calculate the percent change between budgeted and actual costs for each line item, then review which categories exceeded or stayed under budget by the largest percentages. This helps identify problem areas and informs future project planning. Many professional builders use this approach as part of their project management methodology.
Is there a way to show percent change with color coding automatically?
Yes, using conditional formatting. Select your results column, go to “Conditional Formatting” in the Home tab, and choose “Color Scales” or create custom rules. You can set specific thresholds: red for increases above 10%, yellow for 5-10%, and green for decreases. This visual approach makes it immediately obvious which costs require attention, ideal for quick project status reviews.
How do I handle percent change when comparing to a baseline?
Use absolute cell references with dollar signs. If your baseline is in cell B2, use the formula =((C2-$B$2)/$B$2). The $B$2 locks that reference, so when you copy the formula down, it always compares against the same baseline while the comparison values change. This is perfect for tracking how various project costs compare to your original budget estimate.